Indeed Data Professional
Data Professional jobs listed on Indeed.com in 2018

Inspiration
Working as a data professional has quickly become one of the most sought after careers of the 21st century. With the continual advancement in technology, the gathering of data has become vital for companies of all sectors to thrive in this modern age. While collecting data is the necessary first step in this process, it is actually the cleaning, storing, and interpretation of this data that makes it become meaningful to businesses. This is where data professionals add their value by using a large myriad of tools to transform said data in such a way that it provides insight that may have been overlooked otherwise.
This project was designed to help a hopeful data professional understand which careers are available to them and what skills are necessary to possess in order to be considered an ideal candidate for those roles.
Data
A data source was found on Kaggle in the form of an Indeed Dataset. Indeed is a website that provides a worldwide employment-related search engine for job listings. The creator of this dataset collected all the job listings on Indeed that related to data professionals (data analyst/engineers/scientists) in the United States during the year 2018.
Extract | Transform | Load
The dataset was quite comprehensive and included 5715 rows X 43 columns stored in a csv file. The extraction of this data was achieved using pandas which is a software library written for the python programming language.
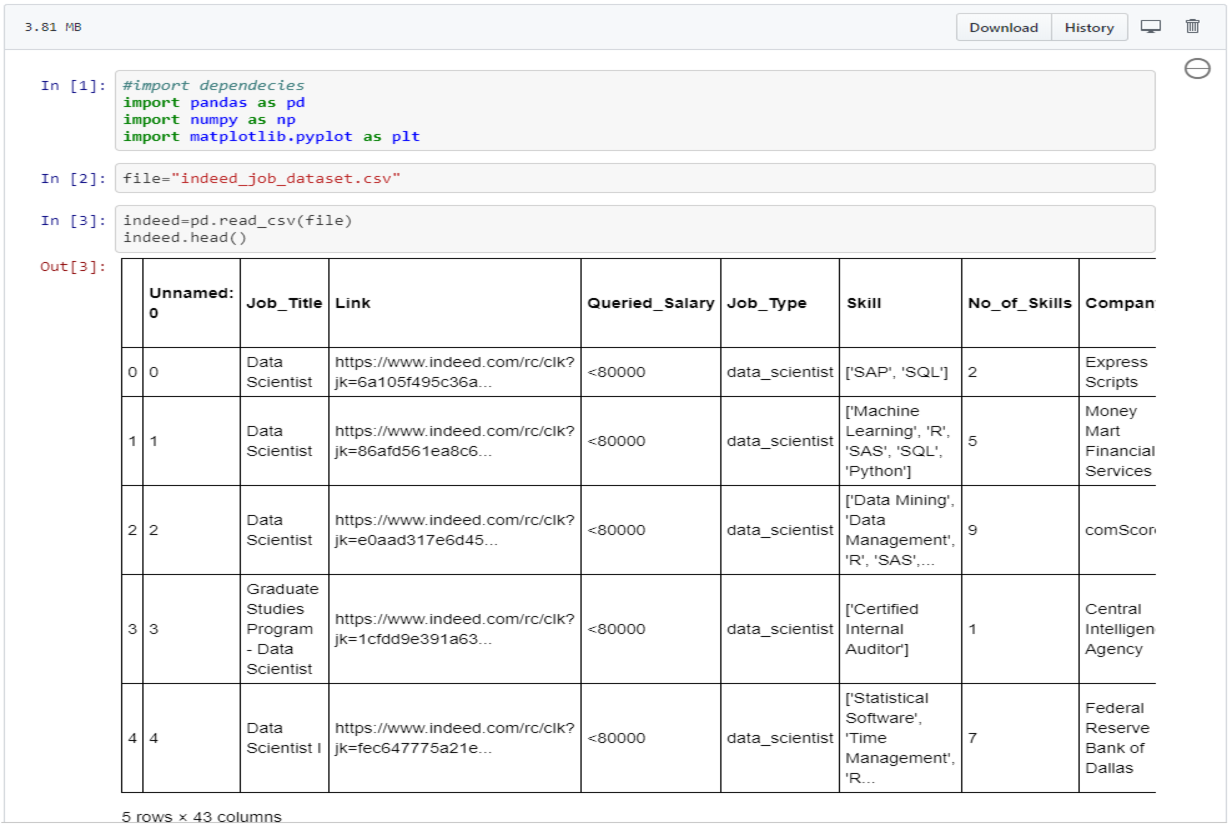
Now that the data had been extracted, the pertinent columns had to be selected. Of the 43 columns 18 were chosen (job title, location, skills, ect) for use. However, before the data could be stored the cleaning process had to take place. One fo the first glaring issues with the data is tht not all the columns were structured, which means that some columns had multiple values in each cell, for instance the "Skill" column above. The problem with unstructured data is it cannot be processed and analyzed using conventional tools and methods. In order to make the "Skills" column a for loop would have to be utilized which included a .split(',') which would separate the values in each cell that are separated by a comma. The values would then have to be stored in individual columns respectively.
Fortunately this dataset had already done something along those lines for the major skills. The next major issue with the data was found in the "Queried_Salary" column. Several mathematical functions (.mean(), .median(), ect) were going to be implemented on the "Queried_Salary" column to yield meaningful summaries. However, those functions require the values to be integers (INT) but these values were in string (STR) form due to the operators (< , > , ect) included alongside the values. In order to fix this the operators needed to be
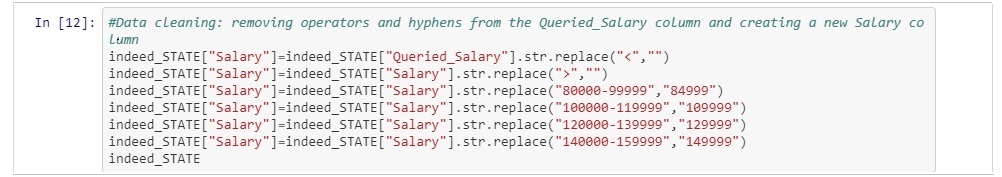
dropped using a .str.replace() function and then storing it into a new column named "Salary" which could be set to type INT using a .astype()

function. Now that the data had been cleaned the analysis could begin.
Data Analysis
During the analysis there were several questions that needed to be addressed. The questions that needed answering included:
- What were the top fifteen states for data professional jobs?
- What was the average salary per state?
- Which companies were offering the most jobs in the data professional market
- What are the top industries/sectors in need of data professionals?
- What are the top four skills needed to become a data analyst, engineer, or scientist respectively?
- What are the top four skills to secure an entry, mid, or senior level job?
Top Fifteen States for Data Professional Jobs
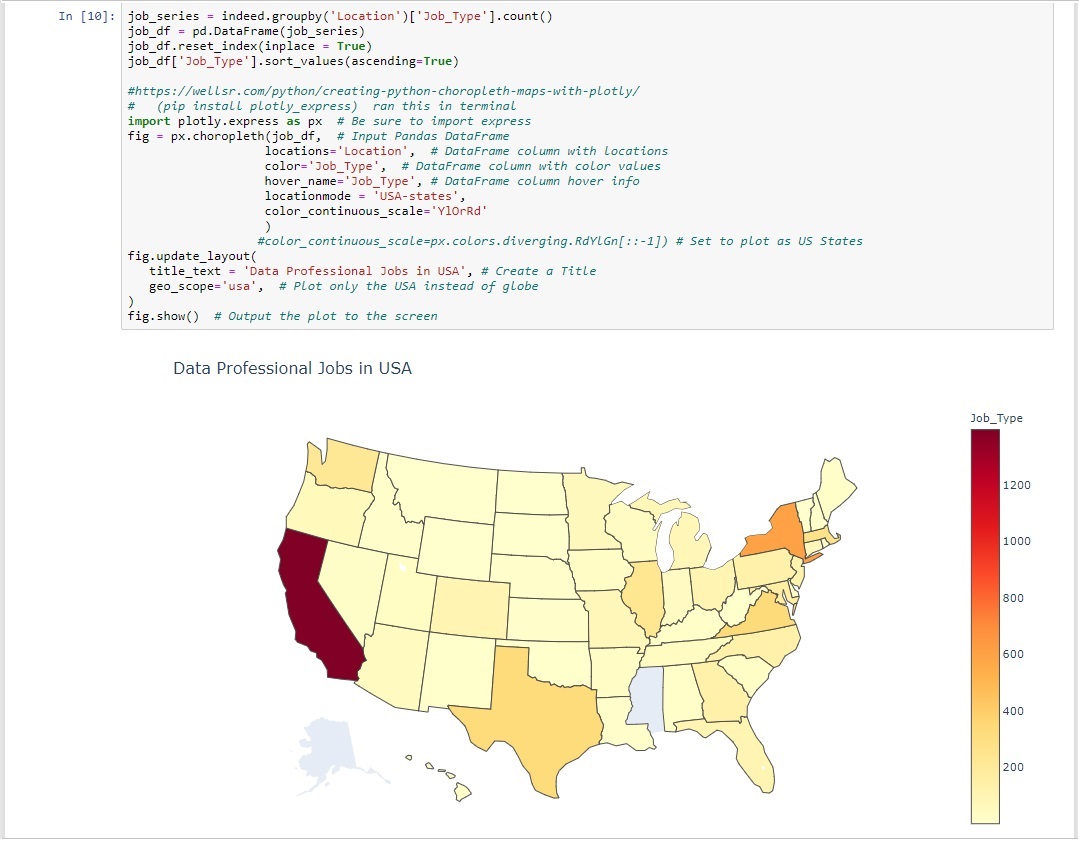
In order to address the first question the indeed dataframe had to be grouped by location using a .groupby() function on the "Locations" from there a .count() function could be called to discover the number of jobs per state.
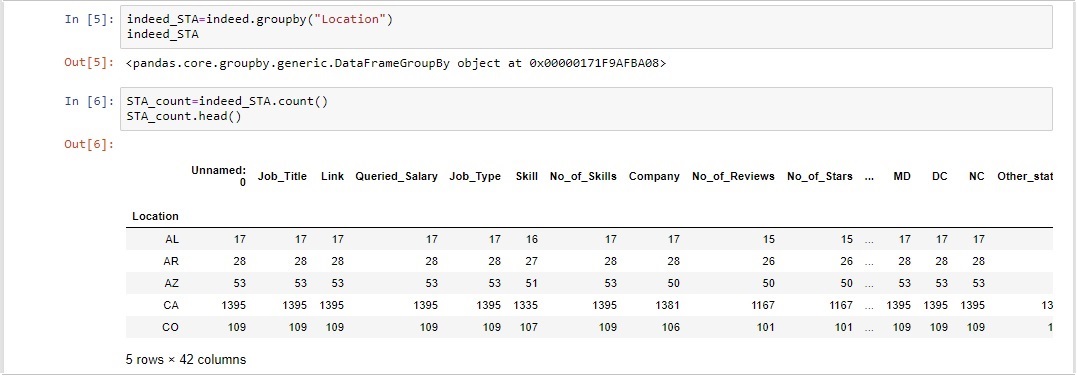
Using the grouped dataframe a bar chart was generated utilizing matplotlib's pyplot library.
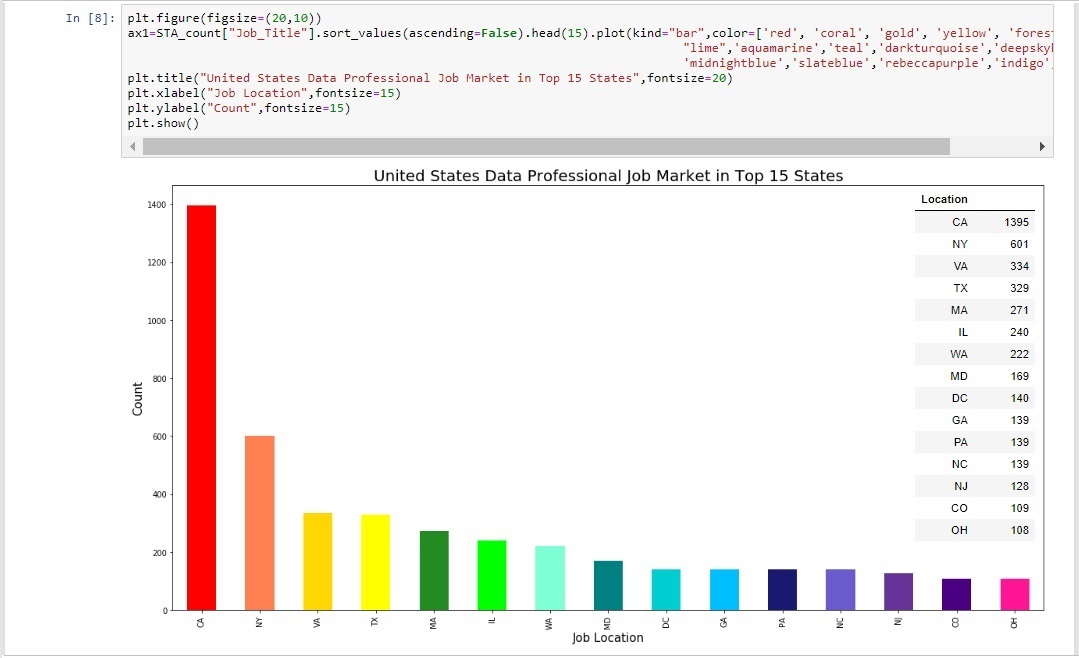
As expected California had the most jobs for data professionals followed by New York, Virginia, Texas, and Massachusets. Due to the sheer number of jobs found in California using a bar chart to display all fifty states would not have been reasonable. Instead a choropleth map was generated to display the data in a more appealing manner. The map was created using the plotly library which is capable of generating choropleth maps based on information fed into it from the grouped locations dataframe.
Average Salary per State
Now that the states with the most jobs had been determined it was necessary to figure out which states offered the highest average salary. Using the cleaned "Salary" column mentioned in the (ETL) section above a grouped dataframe was created based on location once again. This time however a .mean() function followed by a .round() function was applied. This was then stored in a separate dataframe to create the summary table below.
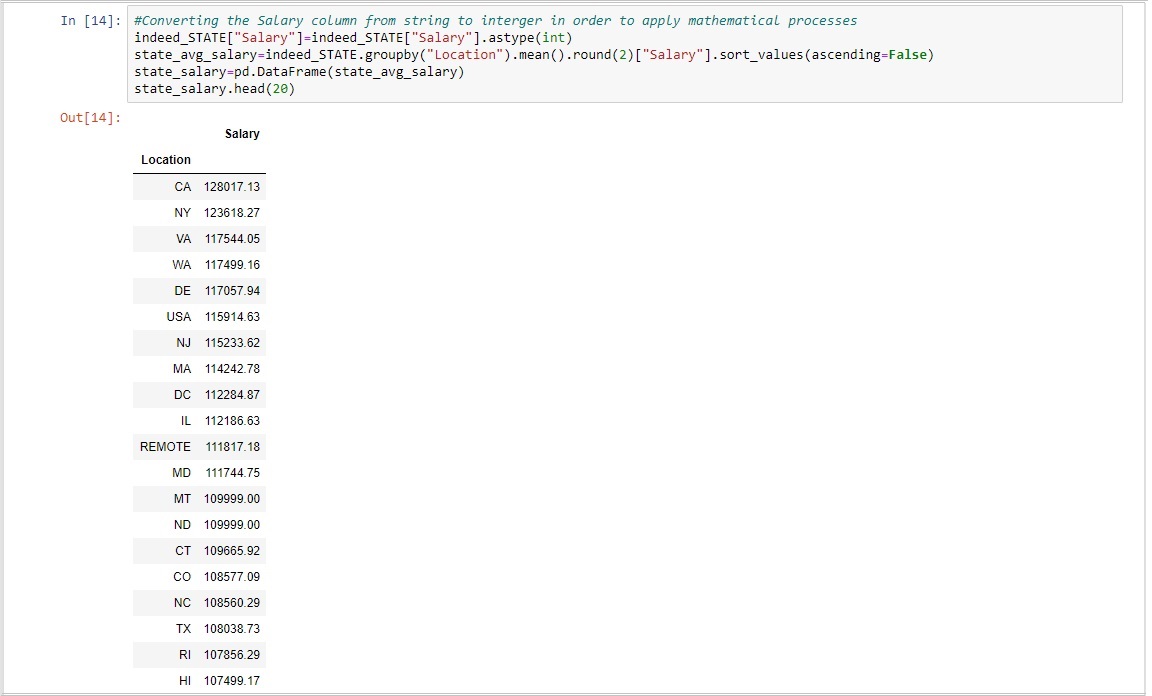
Once again California took the top spot as the state with the highest average salary followed by New York, and Virginia, but this is were the pattern first seen in most jobs per state ended. The fourth highest average salary was found in Washington then Delaware in fifth place.
Companies With the Most Job Listings
The analysis of the data on a state level was now complete so the focus shifted towards the companies listing these jobs. In order to determine the companies offering the most job listings in 2018 a new series was created based on the indeed dataframe's "Company" column. From here a .value_counts() function was used, which returns the counts of unique values. The resulting object will be in descending order so that the first element is the most frequently-occurring element. This object was then stored in a dataframe named "new_company_count_df".

This dataframe was used to create a summary table as well as a bar chart displaying the count of the top ten companies offering jobs in 2018.
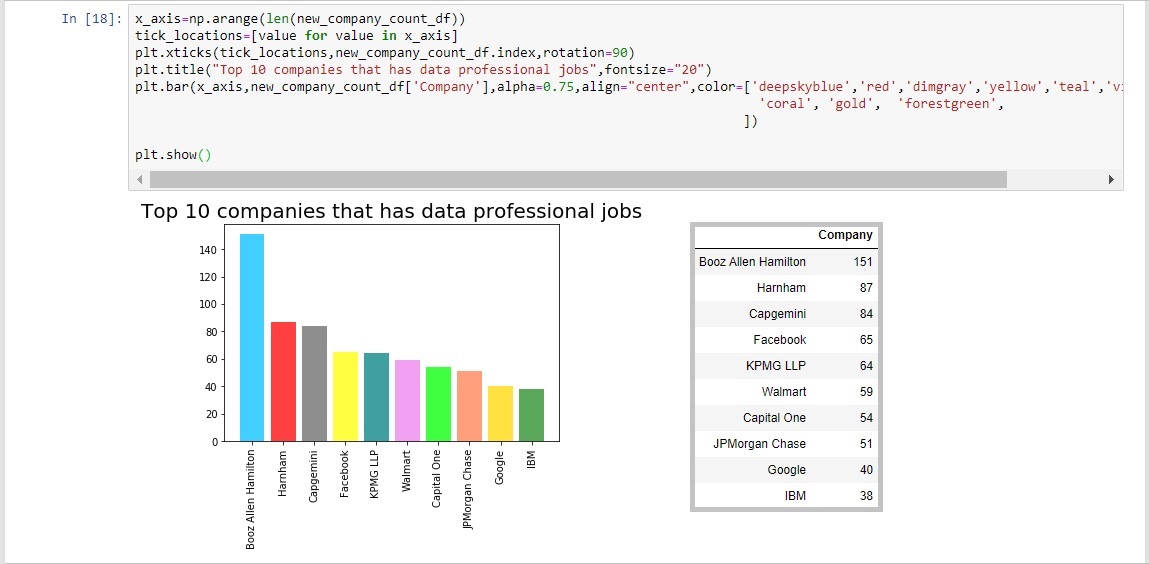
Booz Allen Hamilton had nearly twice the job listings as the next company Harnham. All the companies on this list are very large and well known businesses which is why they are able to offer so many job listings at one given time.
Top Ten Data Analytic Industries
The beautiful thing about data analysis is just how many industries can benefit from it. One thing to consider when entering the world of data analytics is which of these sectors appeals most to the individual. In order to provide a bit more awareness the next question intended to shed some light on what an up and coming data professional could choose from. Similar to to procedures done in the last section a a new series was created based on the indeed dataframe's "Industry" column. Once again a .value_counts() function was used. The resulting object was then stored in a dataframe named "company_indus_df". The index was renamed "Industry Name" and then stored into another dataframe which in turn reset the index to make it a column once again. Finally that dataframe was stored into another which renamed the "Company_Industry" to "Available Jobs". Although the last few steps seemed tedious it was necessary for the pie chart and summary table that would eventually be created.

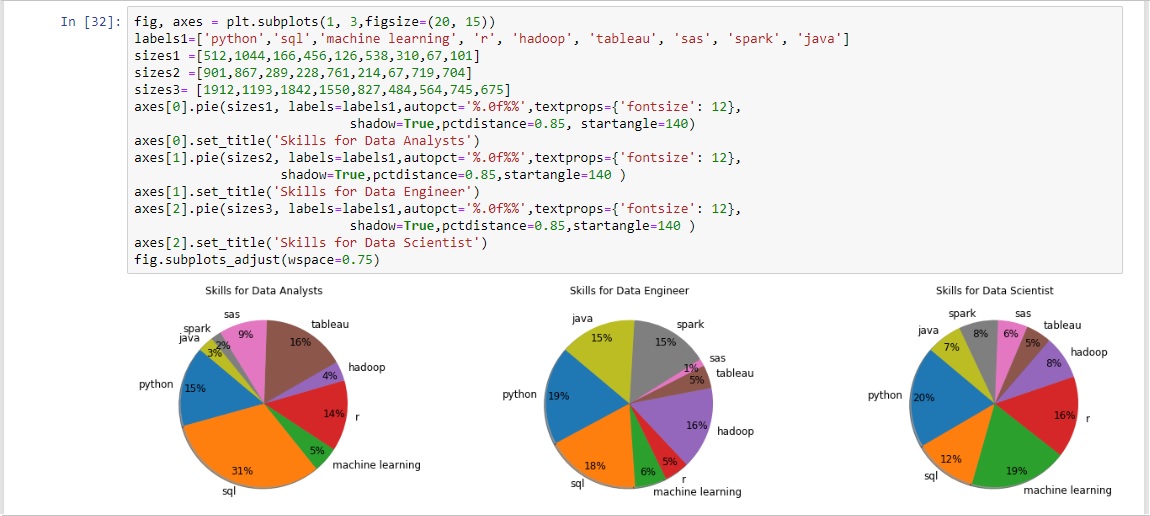
The pie chart was created using matplotlib's pyplot library. Unlike the bar chart this time a plt.pie() function was called.
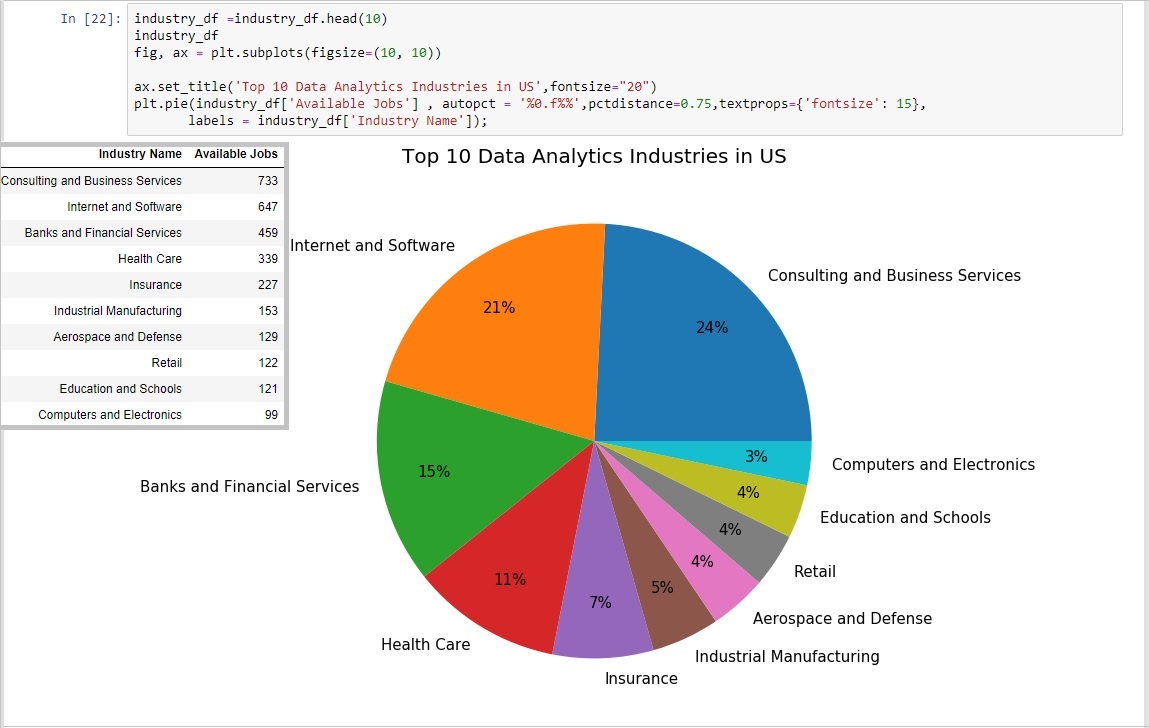
Consulting and Business Services took the number one spot for most popular data professional industry but it has to be mentioned that the number two "Internet and Software" as well as the number 10 "Computer and Electronics" should have been combined into one "Tech" sector which would have made it the overall winner.
Top Four Skills Needed for Data Analyst, Engineers, and Scientists
Up until this point the questions addressed in the data analysis have provided summary information on the data professional information. While this is very useful it wont necessarily help someone become a data professional. The next two questions intend to address that by providing information on what skills are most in demand. In order to discover the skills a new dataframe was created named "indeed_salary" which pulled the job type and skills columns from the original indeed dataframe.
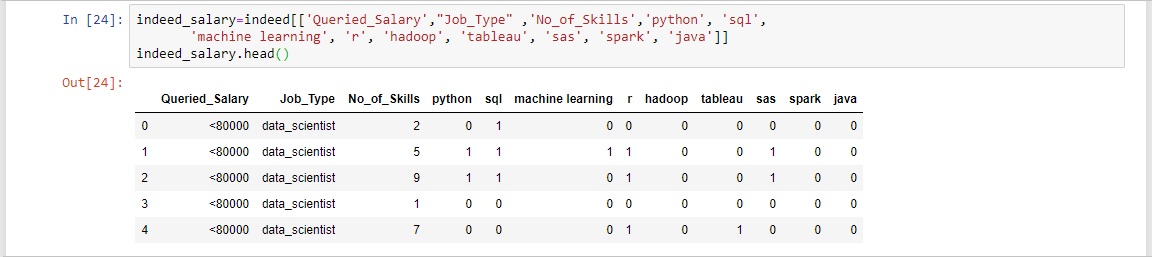
The skills were Python, SQL, Machine Learning, R, Hadoop, Tableau, SAS, Spark, and Java.
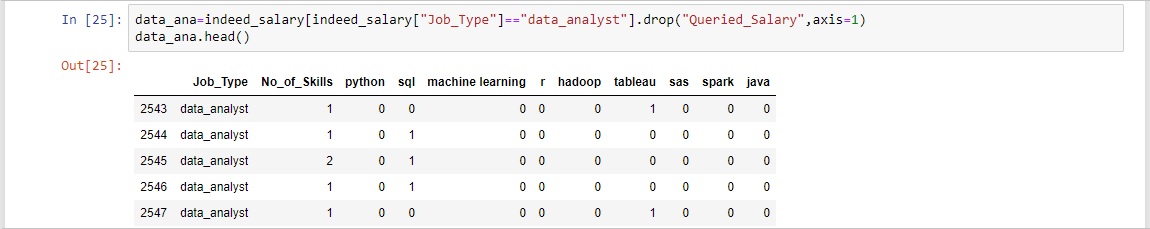
Now that the skills columns had been stored into a dataframe three additional dataframes were made to separate each job type (data analyst, engineer, scientist) from one another. This was done by only selecting a specific role from the "Job_Type" column using a "==" operator which compares the values of both the operands and checks for value equality. If the operand are equivalent then that item will be returned as true and included in the dataframe.
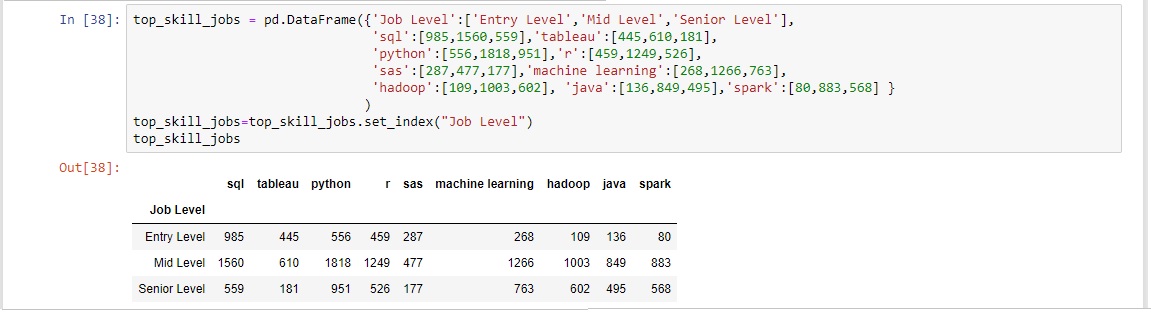
These dataframes were created with the intention of making a summary table of the top four skills per respective job type. However the data needed to be aggregated to accomplish this. Thus a dataframe named job_df was created based of the indeed dataframe with the index set to "Job Type". From here a .loc[] method was called which allows a person to select specified index or indexes in the first parameter and specific columns in the second. Now that the specific indices and columns had been select the dataframe was grouped by "Job Type" and then a .sum() function was called. This produced a dataframe which displayed the total number of jobs requiring each of the specific skills in regards to the job type respectively.
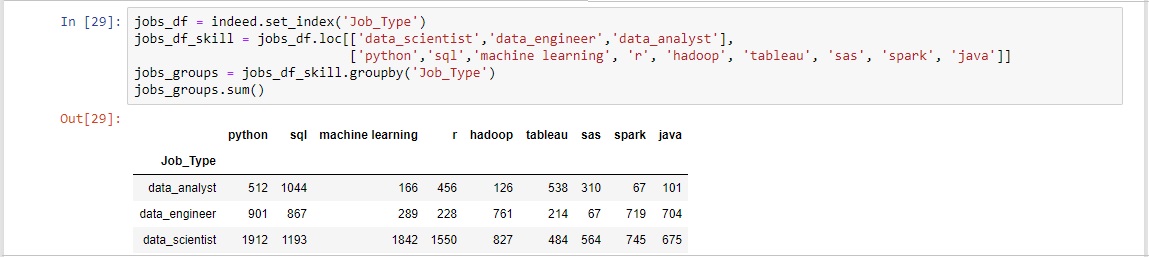
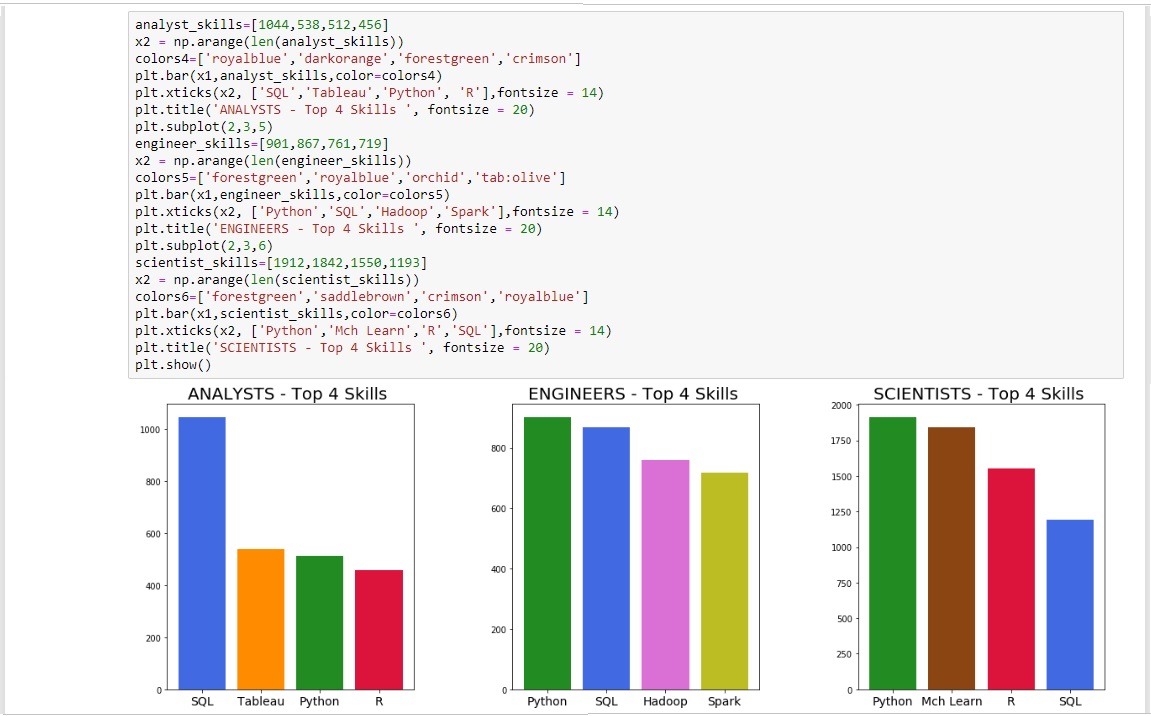
From this aggregated dataframe the summary tables displaying the top four skills per job type was able to be created.
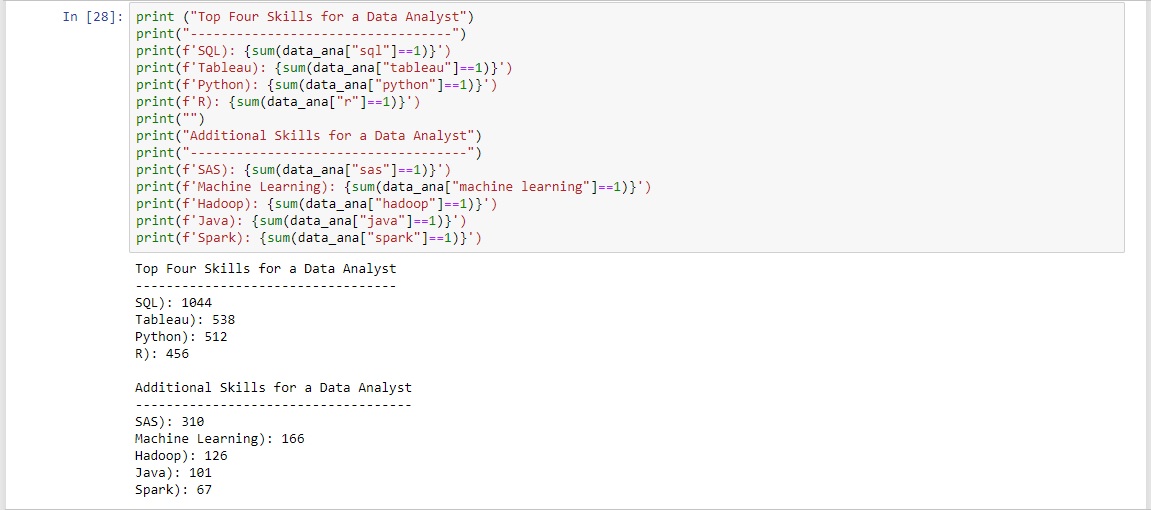
The summary table can be a bit cumbersome to look at so the top four skills were displayed in a much more visually appealing bar chart.
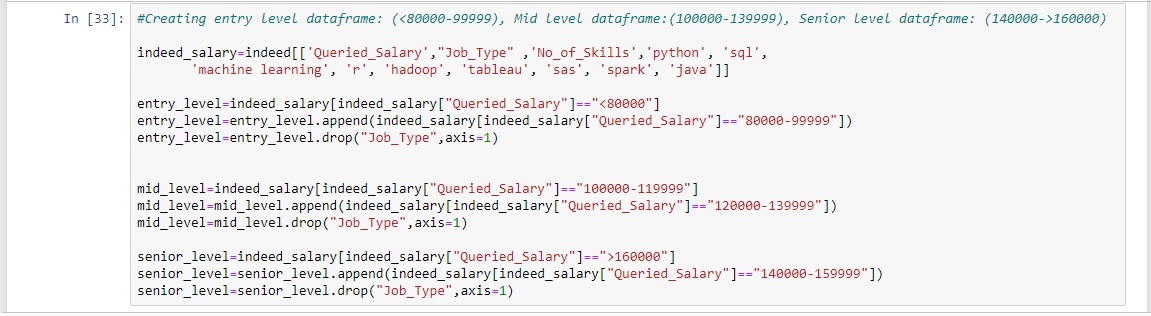
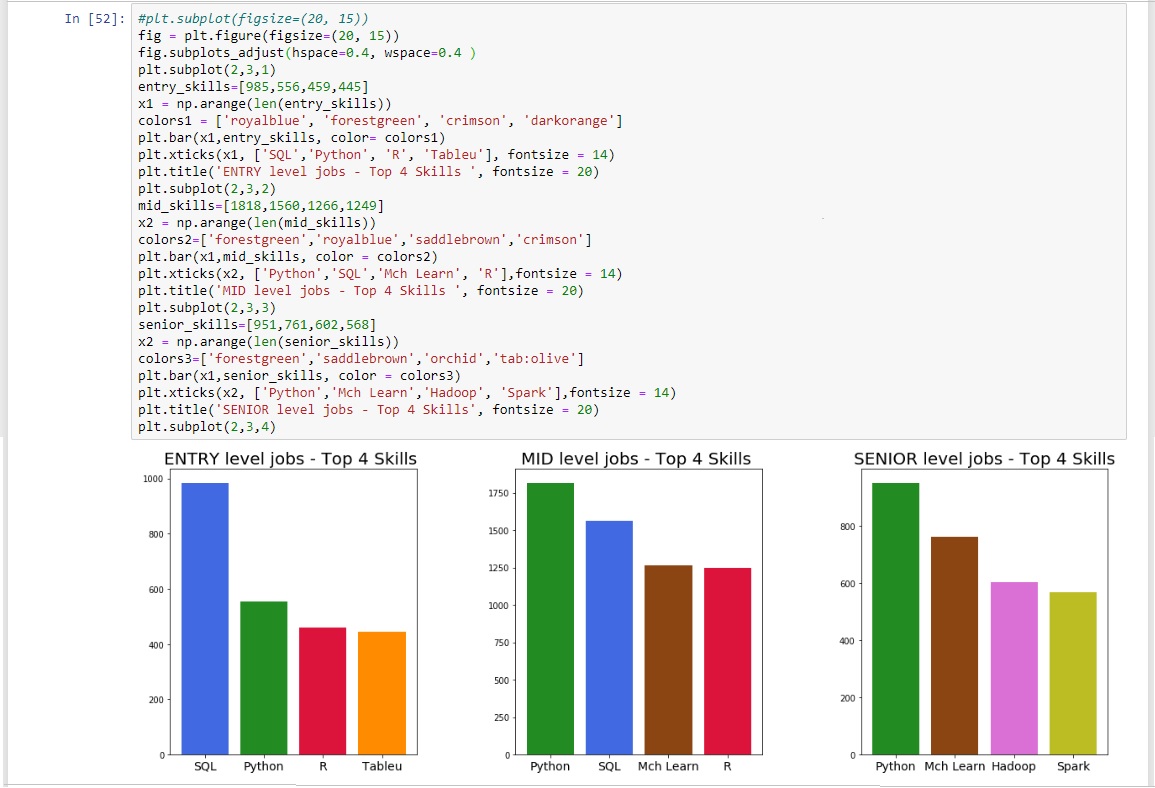
Top Four Skills Needed for Entry, Mid, and Senior Level Jobs
Lastly it was time to discover the top four skills needed for an entry, mid and senior level job. Using the "Salary" column created during the ETL cleaning process the job levels were defined. Entry level jobs were jobs with salaries up to $99,999. Mid level jobs were jobs with salaries between $100,000 and $139,999. Senior level jobs were jobs with salaries greater than $140,000. Now that the salary ranges for each job level had been established three separate dataframes were created to store each job level respectively.
A table of the sum of skills for each salary was then created.
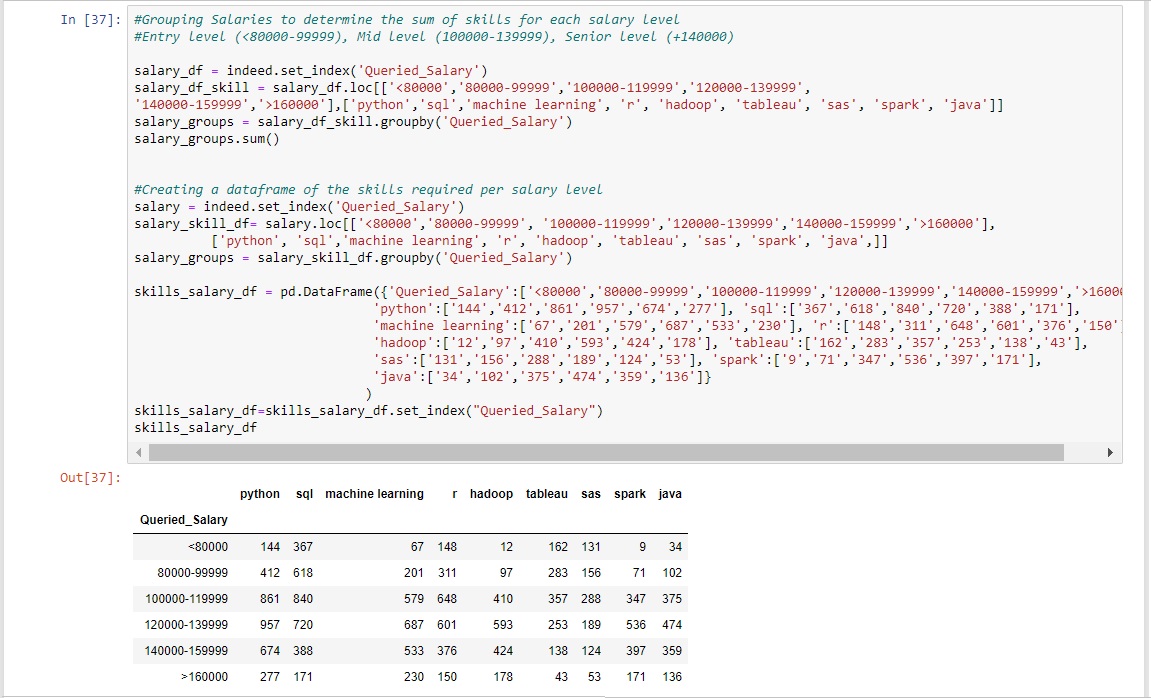
From this a summary table was developed for each salary level.
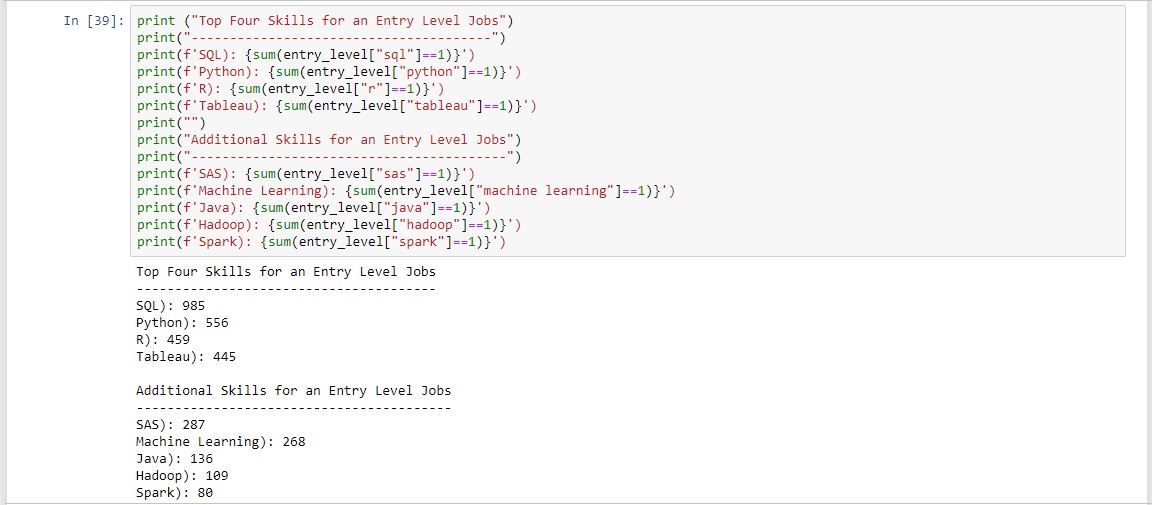
From this aggregated dataframe the summary tables displaying the top four skills per job level was able to be created.
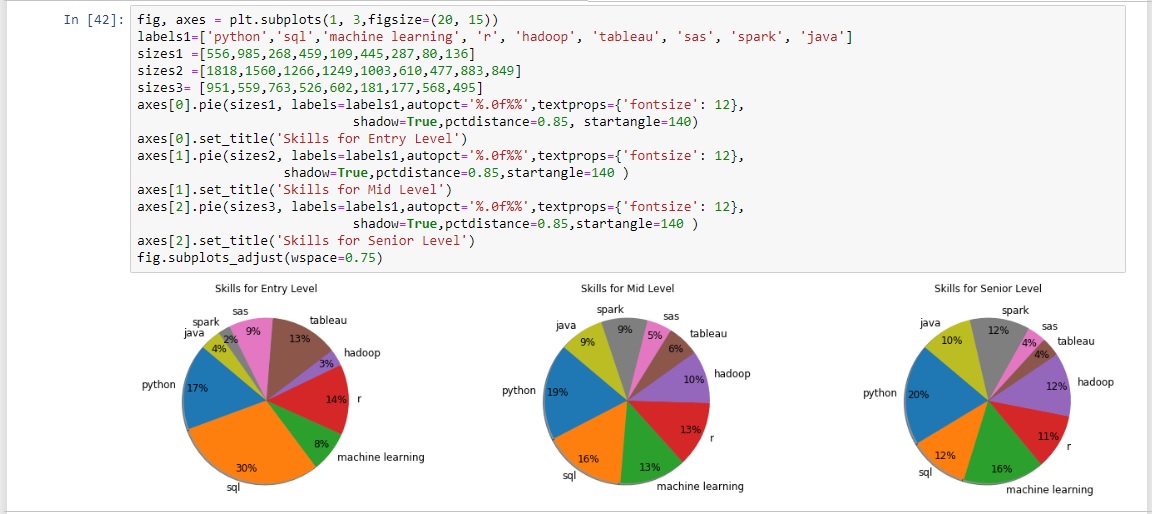
The top four skills for each specific job level were then displayed in a bar chart.
Conclusion
Coming very soon..